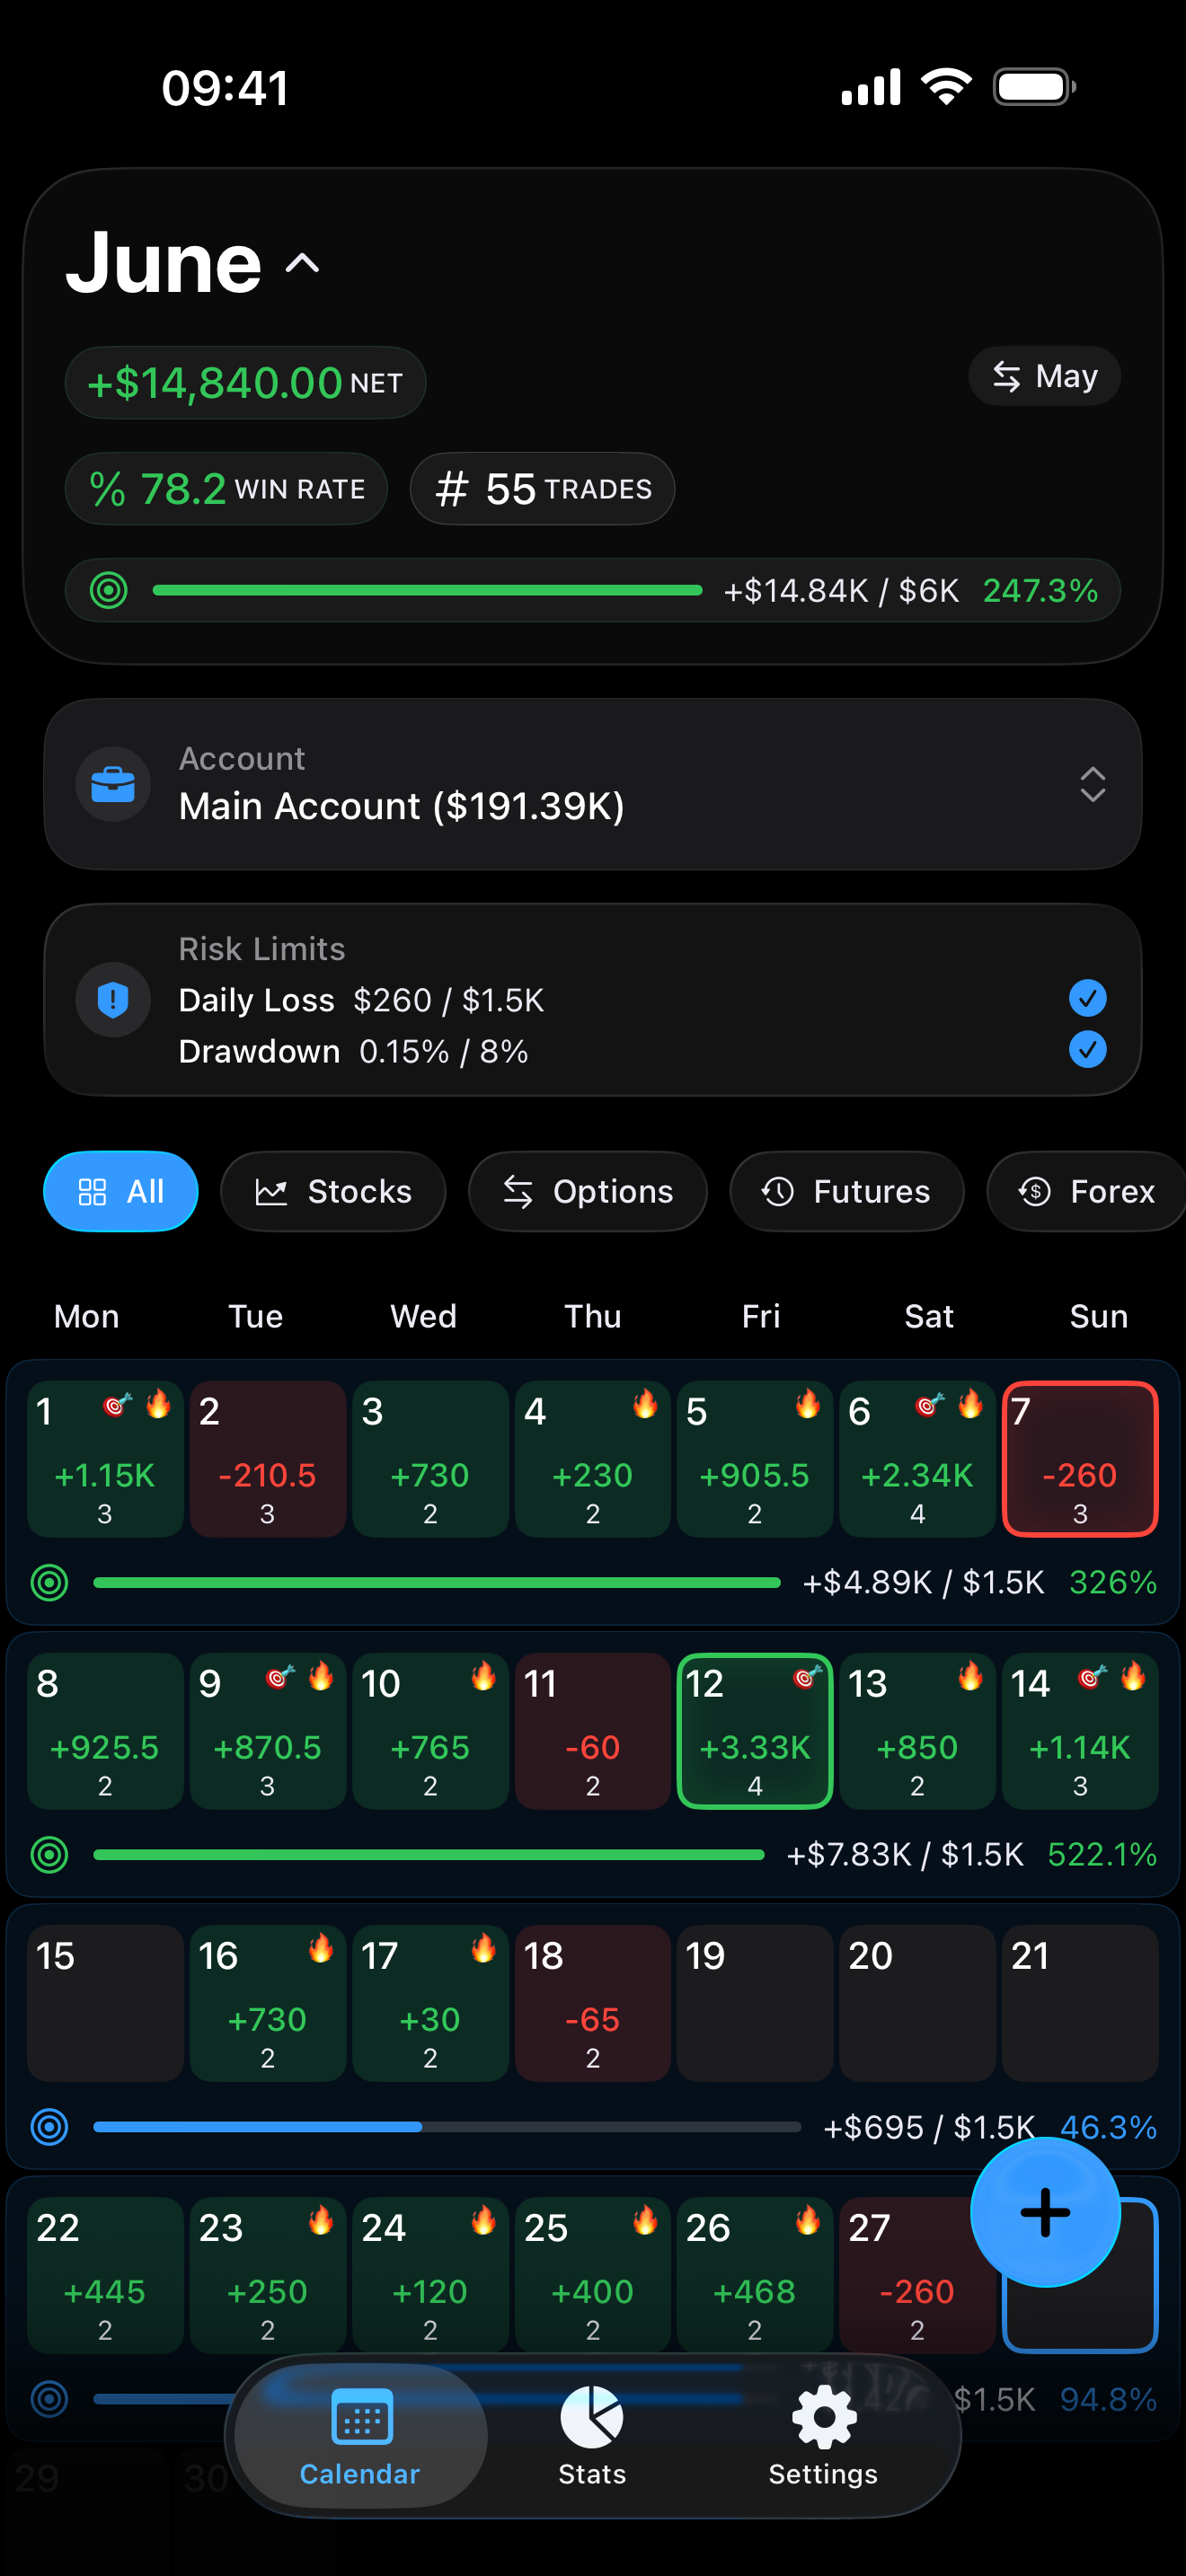
Read the month by pattern, not by memory.
Green days, red days, streaks, goal progress, risk context, and psychology stay visible before the next session.
Trading review with capital context
Proloca turns trades, psychology, Trading Accounts, capital, Profit Goals, Risk Limits, and Equity Curve review into a clear system designed for iPhone.
Built for daily review, not performance promises.

Product proof
Proloca keeps the daily habit light while preserving the details that make review useful: account scope, psychology, goals, risk, and capital movement.
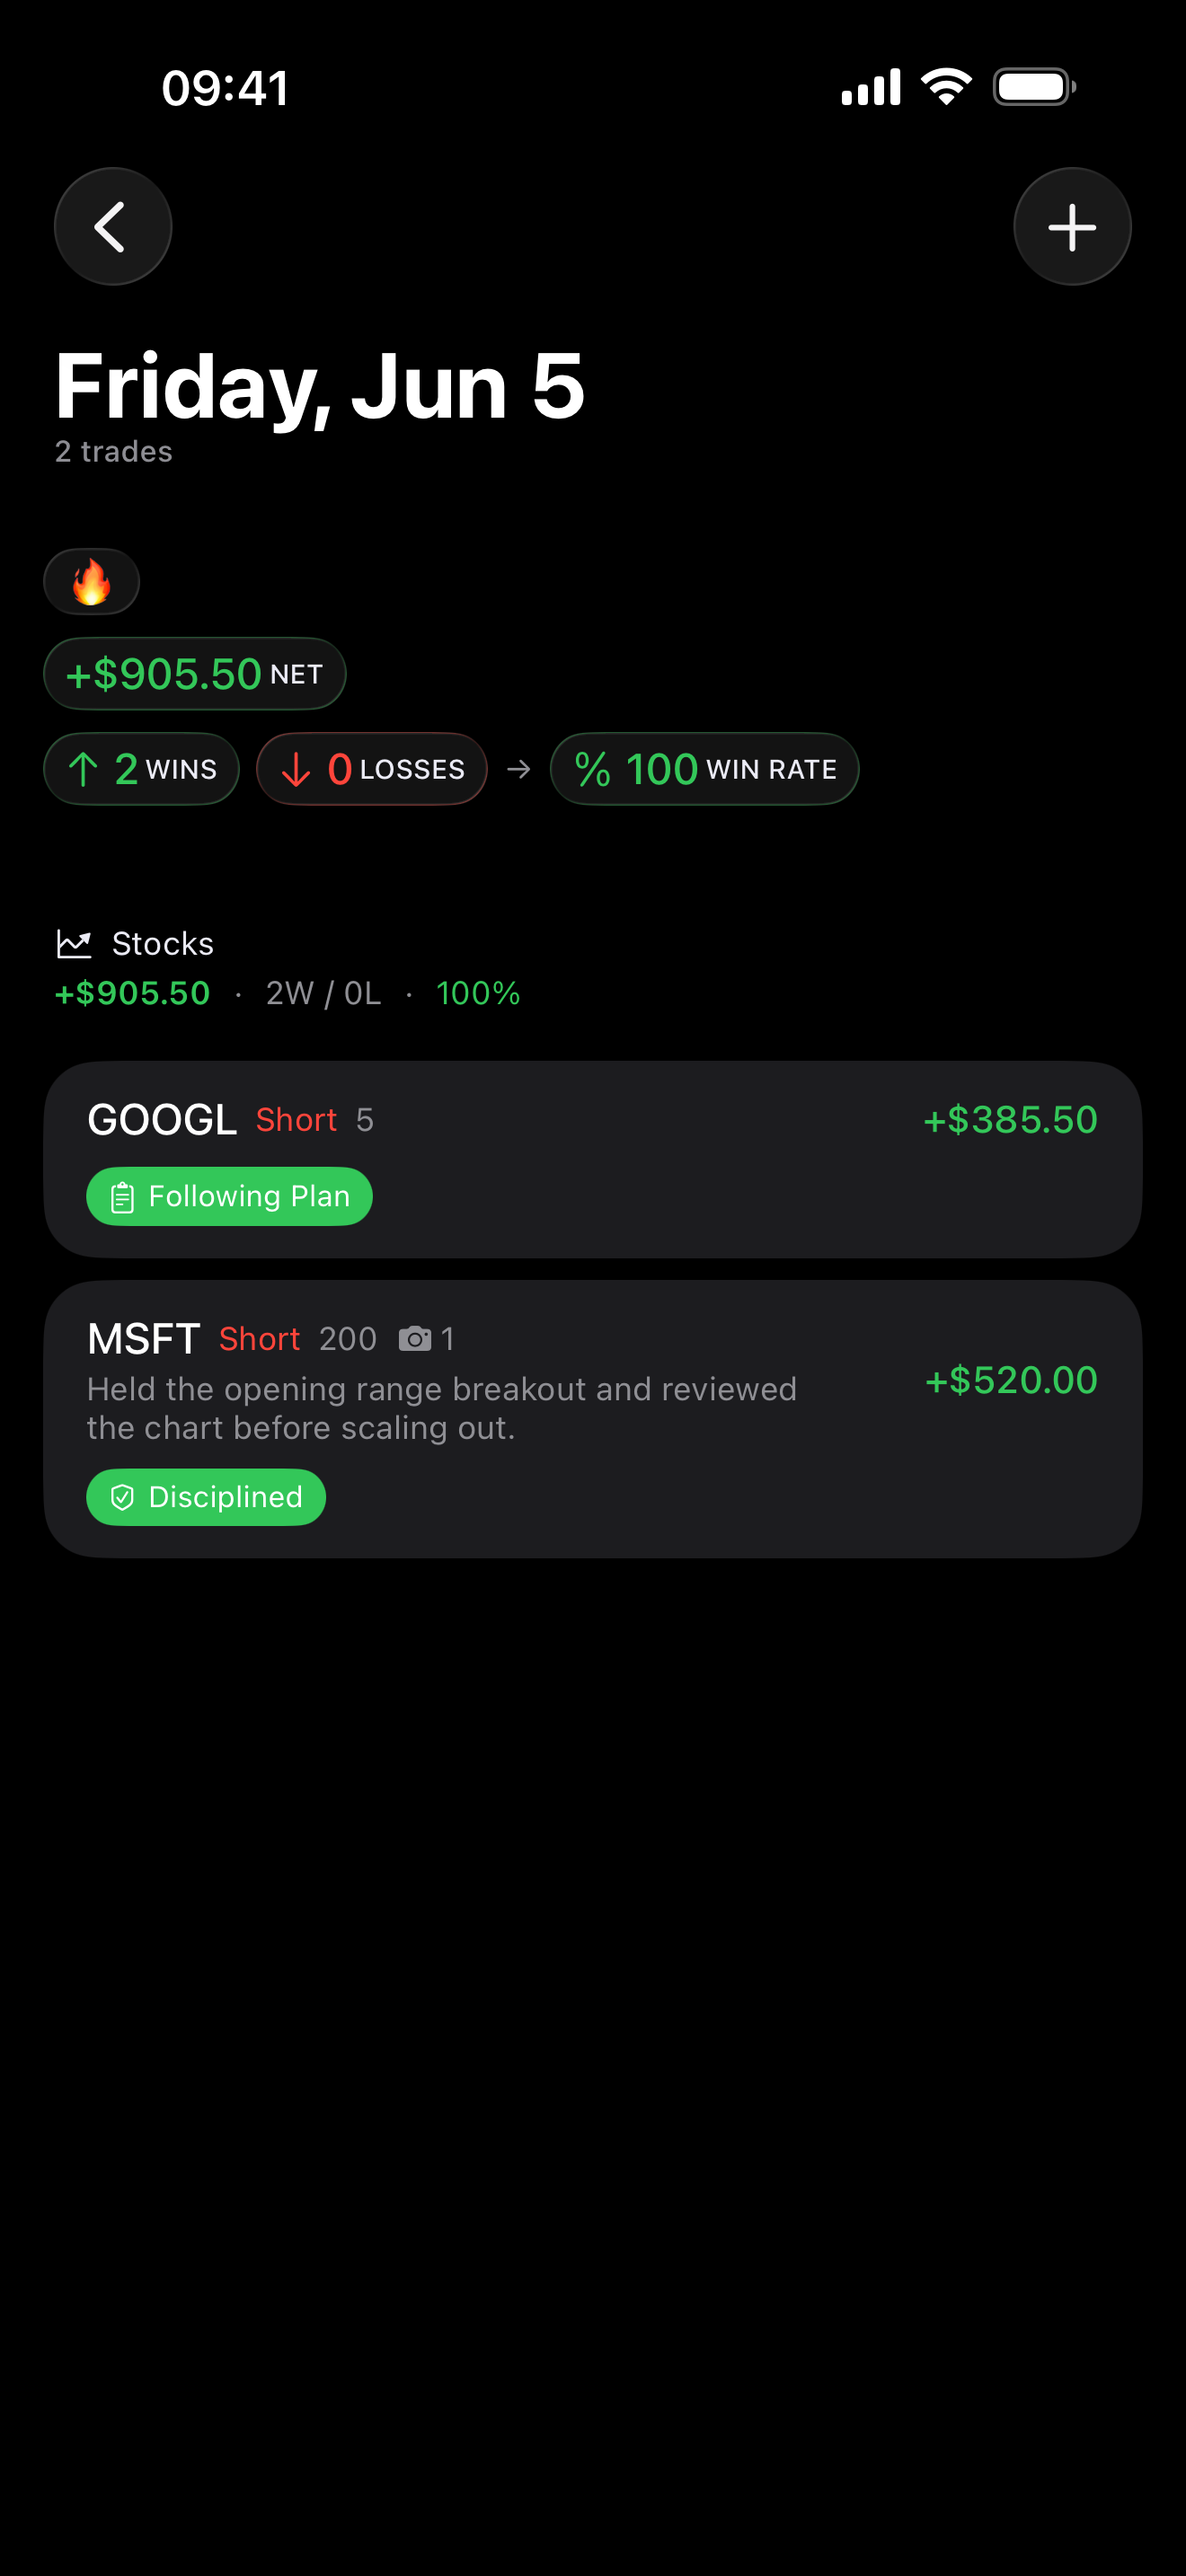
Green days, red days, streaks, goal progress, risk context, and psychology stay visible before the next session.
Keep personal accounts, prop-firm challenges, archived accounts, and All Accounts review from blurring together.
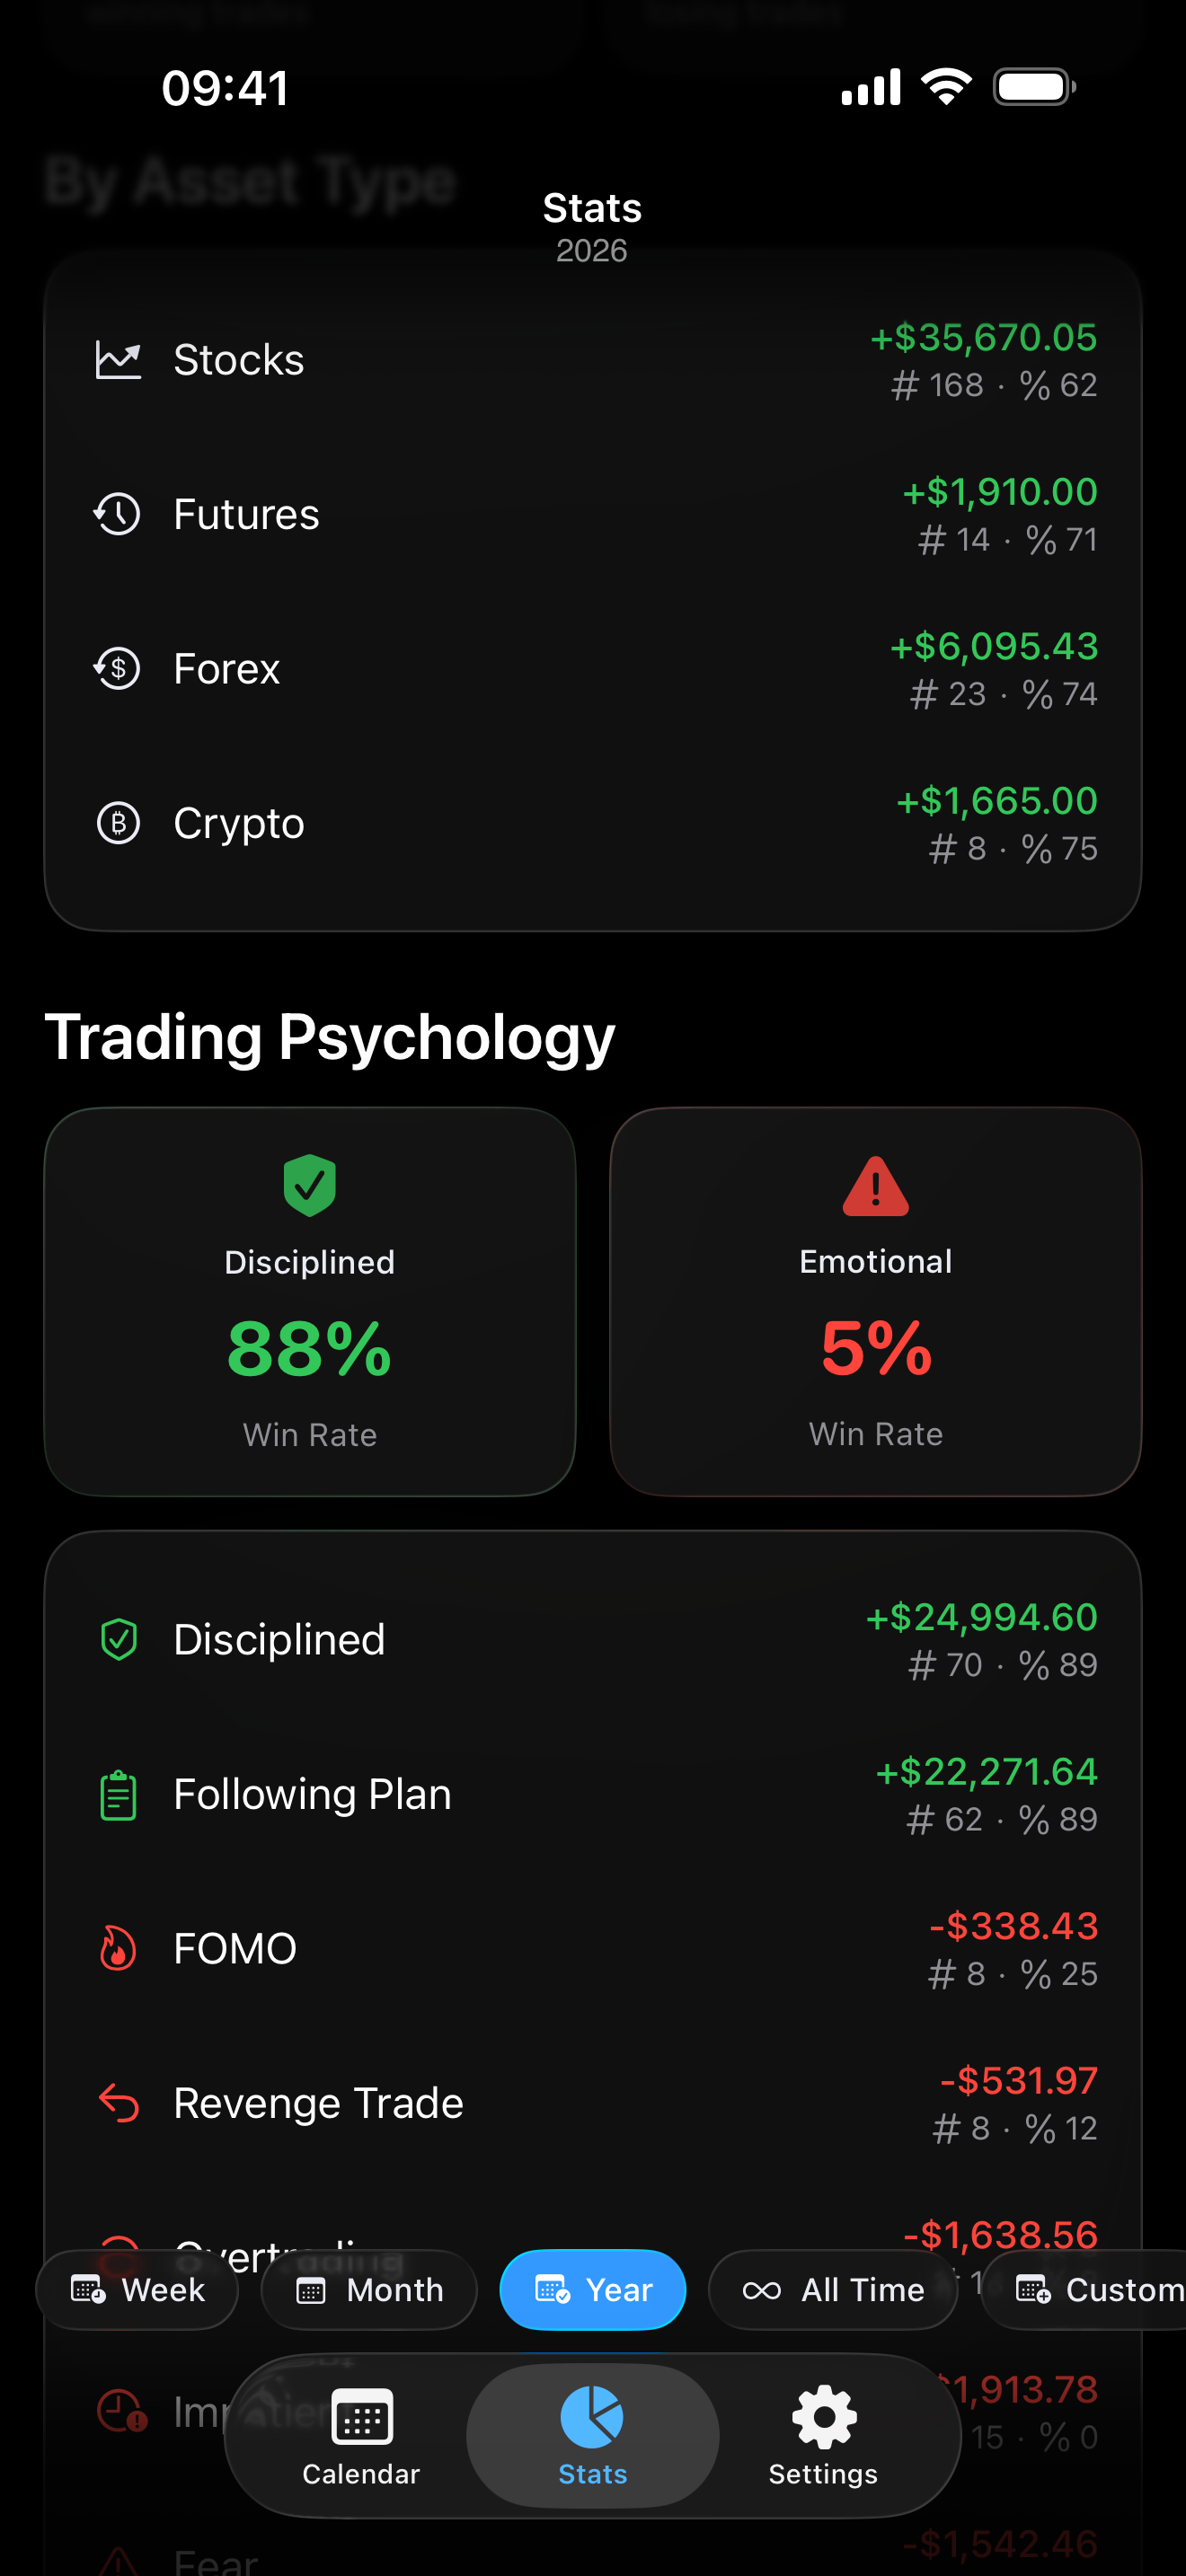
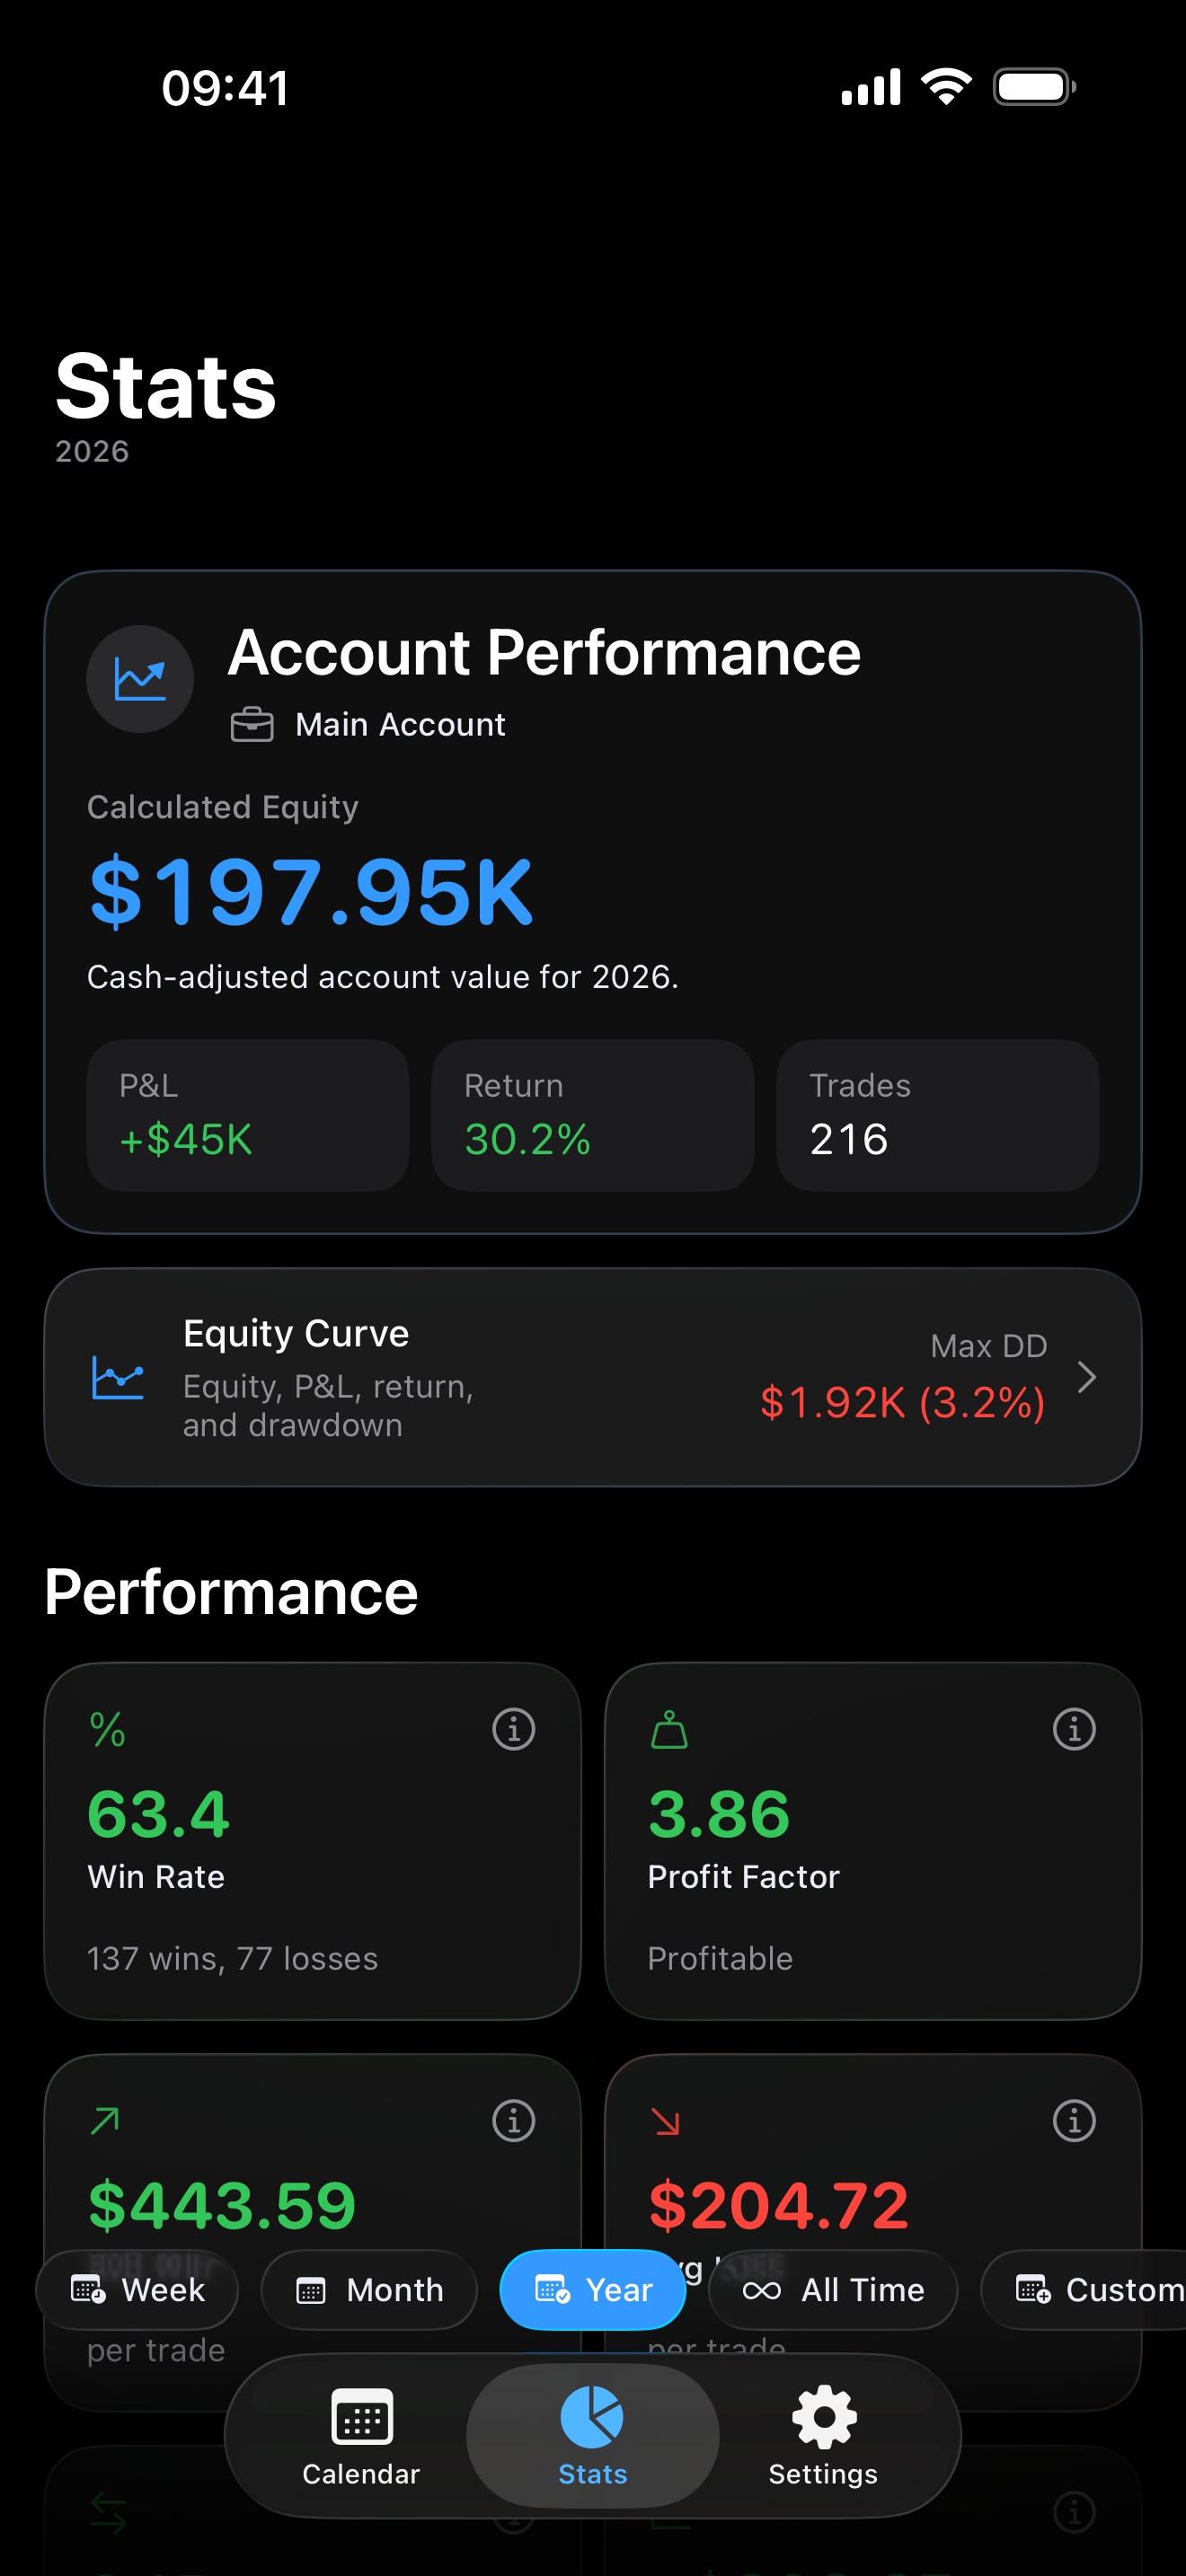
Review Calculated Equity, Trading P&L, Trading Return, and Trading Drawdown without confusing cash movement for trading edge.
New in Proloca 4.0
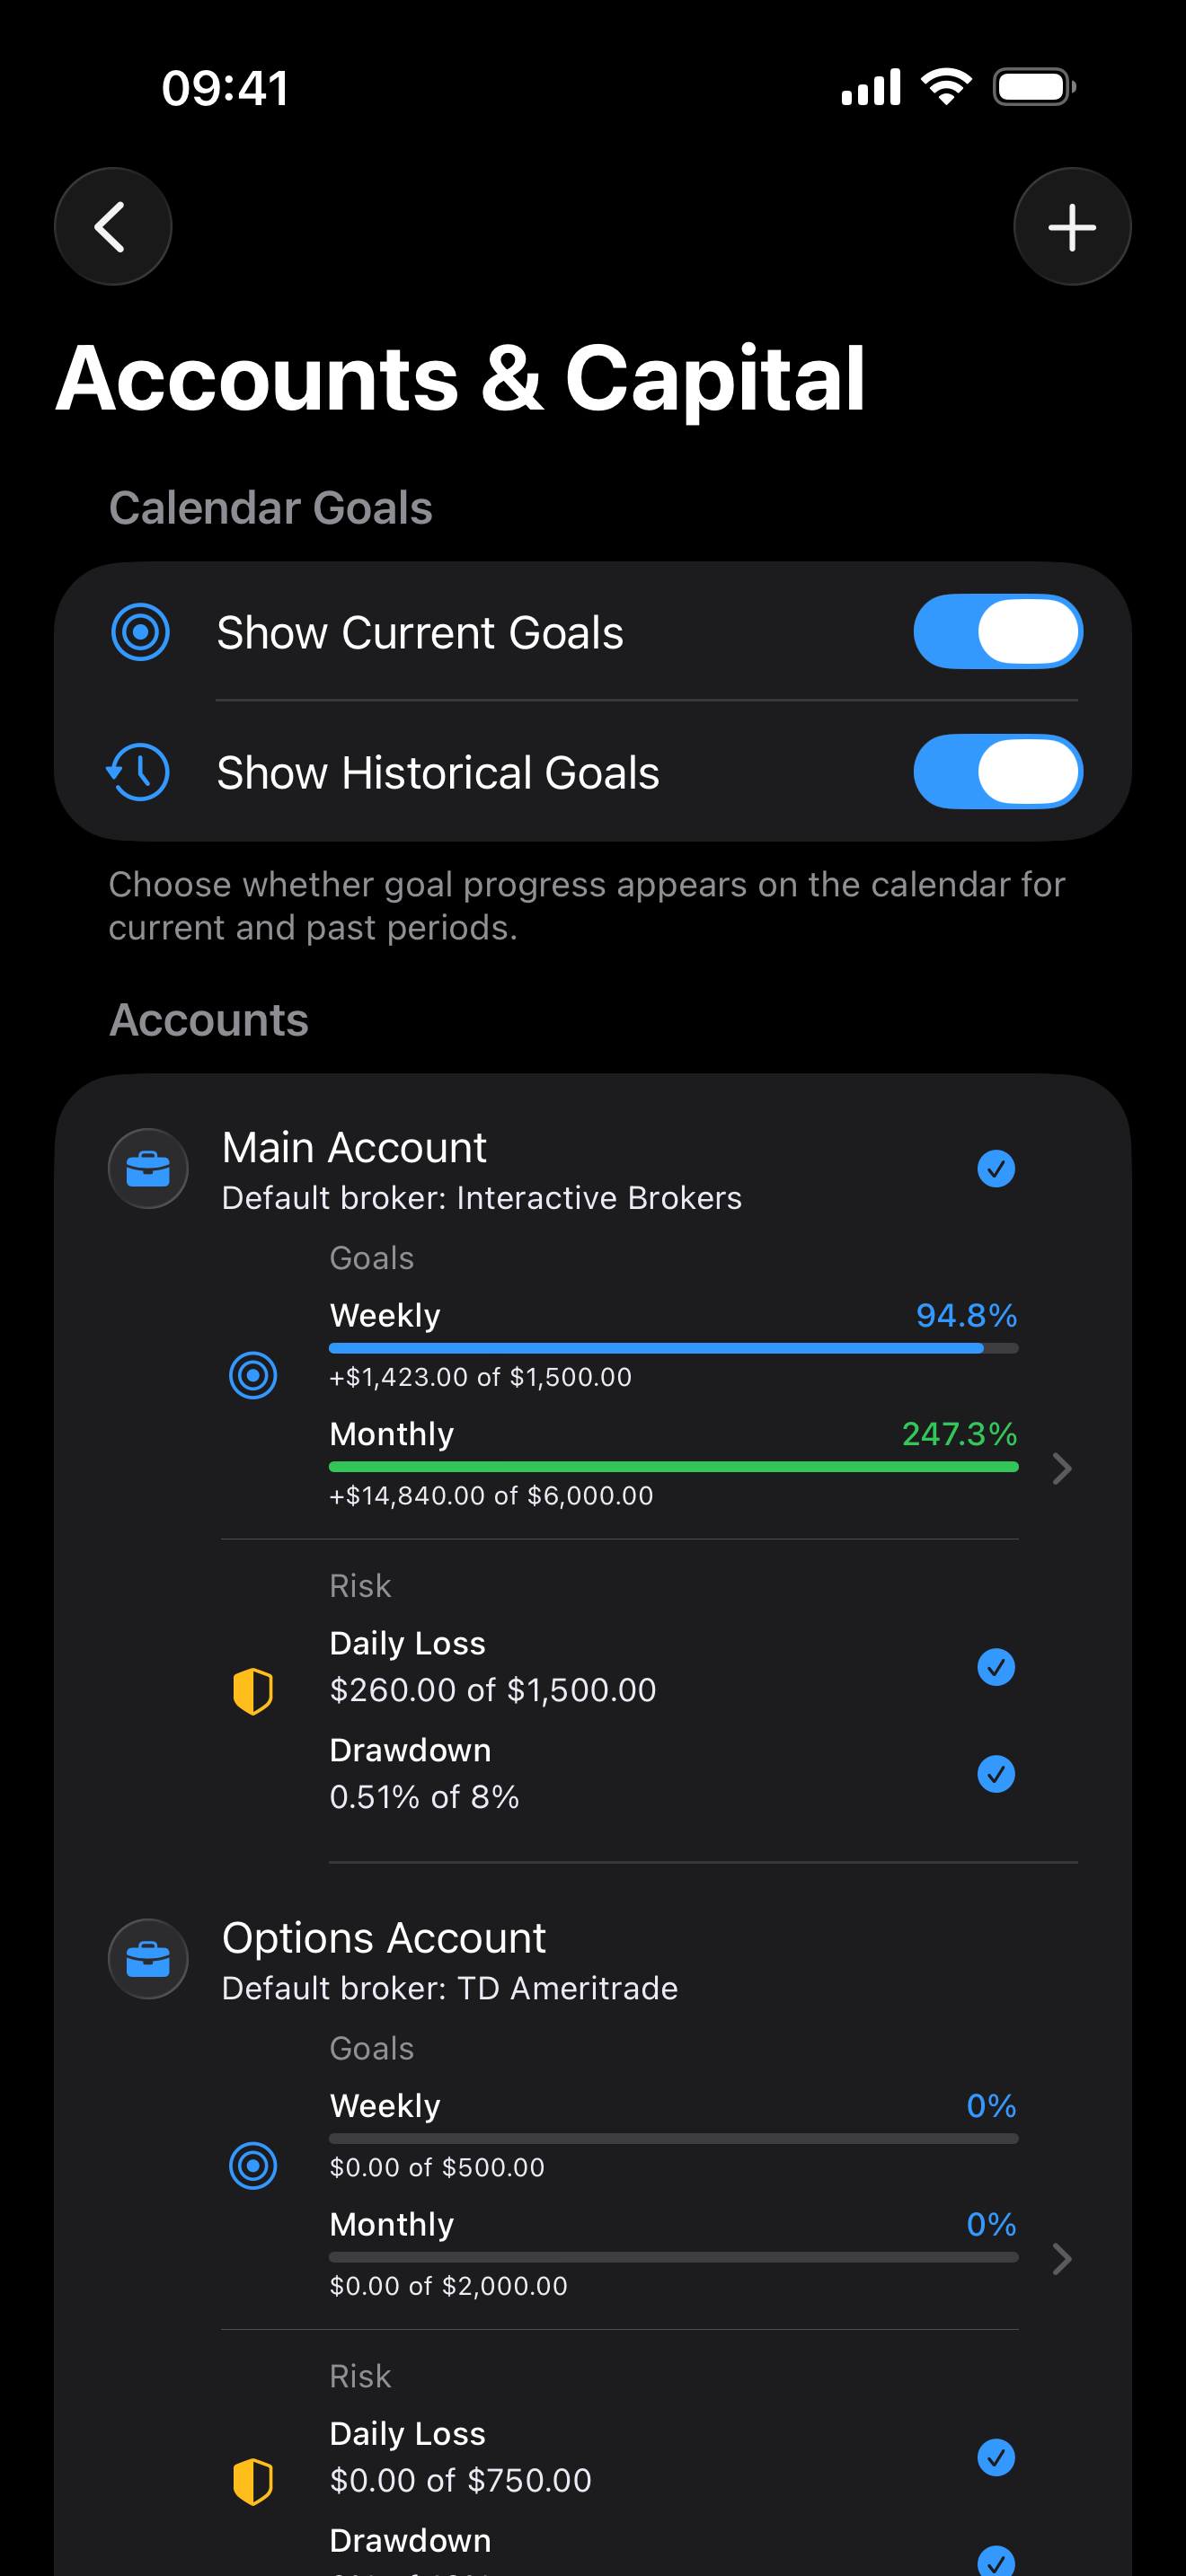
Separate each capital pool. Set a Starting Balance. Record Cash Adjustments. Review Profit Goals and Risk Limits without mixing them into one vague balance.
Proloca 4.0 feature set
The new account and capital layer is designed for traders who manage more than one pool of capital, use prop-firm challenges, or need risk and goals to stay attached to the right account.
Create, rename, archive, restore, and review separate accounts for each capital pool.
See aggregate performance across active accounts while keeping every trade tied to one real account.
Set the capital baseline and date that Calculated Equity should measure from.
Record deposits, withdrawals, payouts, resets, and corrections without counting them as Trading P&L.
Track weekly and monthly targets as fixed money or percentage goals for one Trading Account.
Monitor Daily Loss and Maximum Drawdown limits before risk overwhelms progress.
Switch between Calculated Equity, Trading P&L, Trading Return, and Trading Drawdown.
Import and export Trading Account data so your journal stays portable.
Psychology and execution
Log emotions, discipline, and context so the review is not just a number at the end of the day.
Consistency layer
Widgets, highlights, streaks, events, filters, and account-aware CSV workflows help the habit stay close without turning review into admin.
Private by design
Proloca has no account wall, supports Face ID or Touch ID, keeps export paths open with CSV, and uses iCloud sync when you choose Apple-device continuity.
Resources
Focused pages for traders comparing journals, iPhone workflows, psychology review, capital tracking, and risk-aware routines.